
Do you feel like your rental business isn’t as profitable as you want? I certainly felt that way when I first started out as a landlord. That all changed when I learned how to focus on the right performance indicators for my rental property.
This shift in focus transformed my rental property business. I was able to go from losing thousands annually to turning a profit in a few short years by focusing on the three most important ratios of rental profitability.
In this article I will show you which rental property financial ratios are crucial to your business and why. I will also help you develop benchmarks for each ratio. Finally, I will show you how to develop a rental property Income Statement (also called a P&L) to help you understand exactly where you can focus your efforts on growing your rental cash flow.
I created a customizable rental property calculator that I have used throughout this article. As an added bonus, you can download it for free when you sign up for my monthly newsletter using the sign up form below.
3 Key Financial Ratios Of Rental Profitability
These are what I believe to be the most important ratios when determining your rental property financial performance. There are plenty of metrics you can track but following and improving these three ratios will have the greatest impact on your rental profitability.
The #1 Most Important Metric To Track
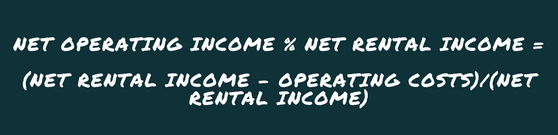
Why Is NOI % of Net Rental Income Important?
Net Operating Income Percent of Net Rental Income (NOI % NRI) is the single most important measure of rental profitability. It represents your operating profit margin. Operating margin is essentially how much cash you have left after running the day-to-day business to pay down debt, make improvements and pay income taxes.
Changes in NOI % NRI over time is the best indicator of how well you are managing your rental properties. You should constantly be striving to increase your operating margin. This is the sign of a truly healthy business.
NOI % NRI is powerful because it accounts for changes in both Revenues and Expenses. You know if you want to increase profits, you must increase revenues and/or decrease expenses. There simply is no way around this law of profitability, no matter what industry you are in.

Understanding the drivers of rental profitability will help you increase your rental business financial performance.
Net Operating Income
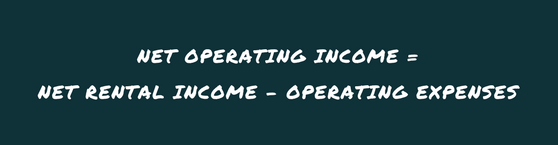
Net Operating Income is calculated by subtracting Operating Expenses from your Net Rental Income.
Here is a breakdown of the components of Net Operating Income.
Net Rental Income
Net Rental Income = Gross Rent – Vacancies + Miscellaneous Income
To calculate your Net Rental Income you subtract Vacancies from Gross Rents and adding any Miscellaneous Income. This represents the value of actual rent and other income you received throughout the year.
Gross Rents
The theoretical value you could have received if all units were rented all year long at 100% capacity.
Vacancies
Subtract the value of any days any unit was available, but not rented. Do not include any days the unit was not available to rent due to renovations or other reasons. More on this below.
Miscellaneous Income
You should also add any miscellaneous income you received such as Late Fees, Pet Rents, Laundry, Utilities, etc. Although these are not the core of your rental business, they represent ongoing operating income and factor into your profitability.
Operating Expenses
Operating expenses represent the day-to-day costs of managing a rental property business such as Repairs & Maintenance, Interest Expense, Professional Fees, Travel Expenses, Property Taxes, Insurance and Administrative Expenses such as a Home Office and Postage.
Non-Operating Expenses
There are several categories of costs that do not qualify as Operating Expenses. Including Capital Expenses, Debt Service, Deprecation and Income Tax Expense.
While these expenses are very important in determining your overall rental business profitability, they are not good indicators of how your rental operations are performing on a day-to-day basis. This is why they are excluded from your Operating Income and NOI % NRI calculation.
However, in order to understand how to build a full Rental Property Income Statement, I will explain each briefly.
Debt Service Expense
Debt Service is simply the interest expense on the loans you have assumed in order to invest in your rental property business. It does not include any principal repayment.
Capital Expenses
Capital Expenses include costs incurred to improve the rental. These costs are not expensed as incurred but rather over their estimated useful life as determined by the IRS (see Table 2.1 of Publication 527 for details).
Depreciation Expense
Depreciation Expense is how you expense a capital cost over time. You are allowed to deduct a portion of Capital Expenditures each year. The biggest portion of your depreciation expense will come from the cost of the building itself, which is expensed over 27.5 years. This was not impacted by the new Tax Law enacted in 2017 despite debate about shortening this period.
PRO TIP
Capital Expenses and Depreciation are often misunderstood. Be sure you are taking full advantage of these often-overlooked tax deductions.
Start Up Expenses
Start Up expenses are Operating expenses incurred before your rental is placed into service. These get a special tax treatment. Learn more about how to handle your start up expenses.
Income Tax Expense
Income Tax Expense is a complex calculation. I highly recommend you work with a professional tax preparer skilled in dealing with investment properties. If you are confident in your abilities in this field, you can look into tax software for rentals. I prefer H&R Block tax software for rentals (Amazon affiliate link) because you can walk into one of their retail locations for assistance if you get stuck. And they are a little cheaper than TurboTax.
Benchmarking NOI % NRI
So what’s a good NOI % Net Rental Income? That depends mostly on your area and type of property. A good rule of thumb is that a profitable rental property will yield a NOI % NRI of about 50% to 60%. It’s a variation of the 50% Rule popular with some real estate investing forums such as Bigger Pockets. However, a good NOI is the one that works for you and is improving over time!
 Sign up for the Accidental Rental monthly newsletter and get instant access to my exclusive Rental Property Calculator. Track your rental property expenses and calculate NOI trends. See a snapshot of where you are spending the most money and find ways to improve profitability today!
Why Vacancy Rate Is The Biggest Killer Of NOI

Why Is Vacancy Rate Important?
Even though vacancies factor into NOI, it deserves special attention for three reasons:
- Vacancy Rates are easy to track
- Vacancy Rates are easy to benchmark
- Vacancies are rental profit killers
Nothing will reduce your NOI faster than an extended vacancy.
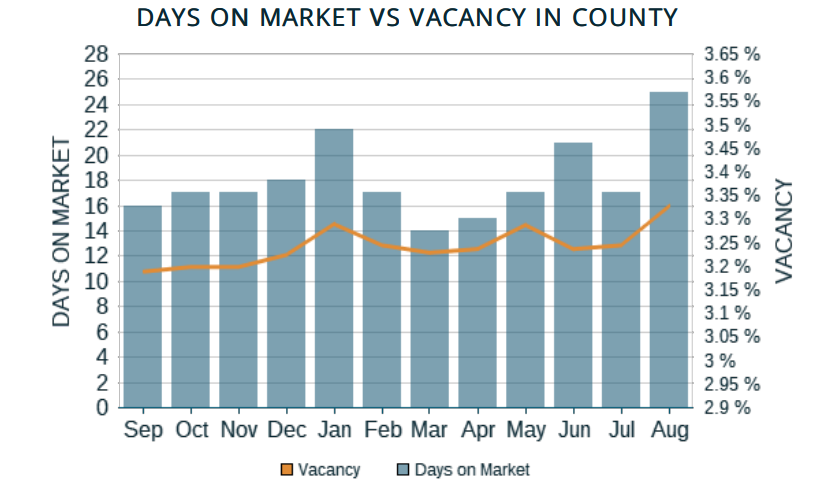
Knowing your market’s average vacancy rate is the key to understanding how your rentals are performing on this important metric. You also need to know how vacancy rates fluctuate each month in your market as well.
If you are lagging your local benchmark then it is an indicator of one or more problems.
Problem #1 – You may be charging too much for your rental property.
You may need to lower you payment in order to be competitive. It may seem counterintuitive, but lowering your rent will actually make you more income! Check out this simplified example below.
| $1,100 Rent w/ Price Cut to $1,000 | $1,000 Rent | |
|---|---|---|
| Months Rented | 11 | 12 |
| Gross Rents | $12,000 | $12,000 |
| Less Vacancy | ($1,000) | ($0) |
| Net Rents | $11,000 | $12,000 |
| Less Operating Expenses | ($6,000) | ($6,000) |
| Less Mortgage Interest | ($3,600) | ($3,600) |
| Net Income | $1,400 | $2,400 |
| Net Income % Net Rents | 12.7% | 20.0% |
You can see that setting the right rent the first time and avoiding the vacant unit for one month puts $1,000 more in your pocket and significantly improves NOI % NRI.
Problem #2 – You are taking too long to turnover your rental units.
Are you being as efficient as possible when turning over a rental property? Have you optimized your process to minimize turnover time and costs? Learn how I save thousands on turnover costs by following my 42-point tenant turnover checklist.
How to Benchmark Local Vacancy Rates
You may be wondering where you can get reliable estimates of the vacancy rates in your area. Luckily, there are a couple of ways you can get this information to assess your rentals against the average vacancy rate in your market.
Ask A Realtor
A local agent who specializes in rental investment properties will have a god idea of the local vacancy rate. Make sure you are dealing with an agent well versed in the local market for rentals. Many real estate agents don’t focus on the investment side of the business and they will not know the local rental vacancy rates as well as one who does.
Professional Rent Analysis Tools
There are a couple of professional rent analysis tools that you can use as well. For a small fee, they provide an in-depth report on the local rental market. The analysis will include a historical vacancy rate for your market area. RentFax and RentRange are a couple of pro sites that I’ve used myself when determining market rents and vacancy rates.
Read my full review of these rent analysis tools for more information.
Local Landlords
Attend a meeting of a local landlord association or Real Estate Investment Club and get to know the experienced members. The experienced landlords in your area will know the average vacancy rates down to the zip code and time of year.
Local Property Managers
Similar to local landlord investors, local property managers need to know the vacancy rates and market dynamics in their area. Ask local investors which PM companies they recommend. Call one up and mention the reference. They will be more inclined to give you a few minutes of their time to help you out.

Don’t have any PM recommendations? Check out All Property Management. Enter your type of property and zip code and they will hook you up with several PM companies in your area. Be polite and ask them if they can give you a rough estimate of the local vacancy rate for your type of rental.
Census Data
The U.S. Census Bureau collects rental vacancy data each quarter. While not specific to your zip code, you can get a good sense of the average vacancy rate in your area of the country. You can also see vacancies by unit type.
How To Correctly Calculate Vacancy Rates
A quick note on how to correctly calculate your vacancy rate. Many websites will tell you to calculate the vacancy rate by dividing the number of units vacant by the number of units available. For example, a 60-unit complex that had 54 units rented is 10% vacant.
This method is OK if you are dealing with large numbers of units. However, as an Accidental Landlord, you want to be more accurate and look at days rented vs. rental days available.
The correct way to calculate a vacancy rate is to take the number of days your unit was actually rented and divide it into the number of days it theoretically could have been rented. This is your true vacancy rate for that unit.
You can calculate this by unit or for your entire portfolio. Here’s an example for a 3-unit portfolio.
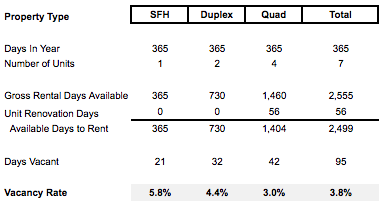
Note that the 3rd unit was not available to be rented all year because it was off the market during major renovations for 14 days. The real vacancy rate for this property is 3.0%. If you counted the renovation days as vacancy days, you would come to 6.7% vacancy rate.
While the vacancy during the renovations is a true cost of business, and impacts your NOI, I do not believe it should be counted as a vacancy. Vacancy Rate should be measuring how well you are marketing and turning over your available rental inventory. It should not be impacted when a unit is removed from the market. This is how I look at it anyway. Let me know your thoughts in the comments section. Do you agree or disagree?
Cash On Cash Return Is King


Why Is Cash on Cash Return Important?
Cash is King as the saying goes and nowhere is this truer than in real estate. The primary reason many of us invest in rental properties is for the cash flow. Every landlord understands the implications of cash flow on a rental business. Shouldn’t you know how your rentals stack up on this important metric?
You need to track Cash on Cash Return over time to ensure your investment is always working as hard as possible for you. If your investment is not delivering a Cash Return that you can achieve in another investment, you should seriously consider liquidating that property and re-investing the proceeds in a better property.
What Is A Good Cash On Cash Return?
How much return you should expect is a personal matter. It depends on your situation and your alternatives. I like to see at least 10% Cash on Cash return and I have properties that deliver well above this but that is what I look for generally.
You may find 6% is fine for you. Stay away from anything lower than what a high rated corporate bond will yield. You want a premium for the extra risk you are taking on as a landlord.
How To Calculate Cash On Cash Return?
Cash on Cash Return is a pretty simple concept. How much cash did your cash investment return over a period of time? Note you do not include your full purchase price but only the portion you paid for with cash.
Cash Invested
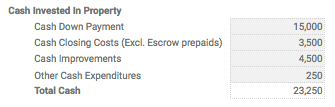
Determining your cash investment should be simple. Add up all of the cash you invested in the business since you acquired it. Include your down payment, closing costs (excluding escrows and prepaids) and any cash outlays for capital expenditures.
Remember that Capital Expenditures do not show up in your NOI so don’t forget to include this in your cash investment. Note that if you borrow money to fund any CapEx that this does not figure into your cash investment either.
Here is the example table included in my rental property calculator:
Cash Returned
Determining the Cash Returned on an investment property is simply a matter of reviewing your income and expenses and adjusting for non-cash items. Most landlords will only have one large non-cash item in their Profit & Loss statement: Depreciation.
The formula at the beginning of this section is the long way of saying this:
Cash on Cash Return = (Net Income + Depreciation) / (Cash Invested)
To determine Cash Flow, you simply take your Net Income and add back non-cash items, like Depreciation. This will represent the cash your rental property added to your bank account at the end of the period.
Don’t worry if this all seems intimidating. I will take you through a full rental property income statement below.
I’ve created a rental property calculator that you can download for free and start using today! Sign up for my monthly newsletter and as an added bonus I will send you a link you can download right away to help you get started.
Other Rental Profitability Metrics To Consider
There are of course, many other metrics you may want to consider tracking. I list several below but none, in my opinion, will give you a better understanding of your rental business fiscal health like the three metrics above.

Tenant Satisfaction
Tenant satisfaction is a good predictor of your future vacancy rate. So in this sense it is a useful metric. But it isn’t as reliable as your financials.
You can take a periodic survey of your tenants and ask them to rate several attributes like management responsiveness, common area cleanliness, general enjoyment, likelihood to renew, etc. But be careful, the responses you receive are likely to be biased towards negative sentiments. Tenants are less inclined to offer their feedback if all is well.
You can offer a small incentive to complete the survey such as $5 or $10 off rent. But then this introduces a positive bias. No one wants to say something negative to someone who is giving him or her a gift.
If done correctly, an annual tenant survey can be a great way to stay competitive in the marketplace and avoid vacancies. Rentec Direct has a great article on the subject of Tenant Surveys if you are interested in learning more.
 Turnover Time
 Turnover Time
Vacancies in the U.S. are currently averaging 7.0% to 7.5% in 2017 according to the Census Bureau. That’s about 4 weeks or $1,000 in lost rent for the typical rental! Continuously improving your rental turnover time will greatly increase your NOI.
The key to minimizing this cost is to have a process or checklist that you run every time you have a vacancy. Keeping to a strict schedule could shave days or even weeks off this time and save you hundreds per vacancy. I average about 2 weeks per vacancy by using a checklist.
You can read more about how I minimize tenant turnover times and if you sign up for my monthly newsletter from this link, I will send you my own 42-point tenant turnover checklist.
Cap Rate
Real Estate Investors love to talk Cap Rates (Capitalization Rate). There are plenty of great articles out there that go in depth on the subject so I won’t spend a lot of time on this one. Basically, your Cap Rate is a measure of how much Operating Income your property returns as a percent of your total investment. It differs from Cash on Cash return in two important aspects:
- It doesn’t account for your Cost of Debt or Tax Expenses. Remember that Net Operating Income is the Net Rental Income less any Operating Expenses. Operating expenses do not include expenditures for mortgage interest or income taxes.
- It is calculated on your total investment, not just your cash outlay. Unless you paid cash for your property, your total investment will include the mortgage or any other debt you assumed to finance the property. For this reason, your Cap Rate is typically much lower than your Cash on Cash return.
Cap Rate is useful in determining what your property is worth relative to similar properties in your market. If the average comparable Cap Rate is 8% and your property generates an NOI of $12,000 per year then your property would be valued at $150,000. You can read more about how to calculate and use your Cap Rate from this article from the Balance.
Want even more Rental Property Financial Ratios?

- Coach Carson offers a great article with his go-to Income and Equity metrics he uses when investing in real estate.
- I also highly recommend you pick up a copy of Ken McElroy’s The ABCs of Real Estate Investing: The Secrets of Finding Hidden Profits Most Investors Miss (Rich Dad Advisors)
. Ken guides you through these ratios simply and clearly while giving you valuable tips on how the pros save money in the process!
- Finally, Frank Gallinelli’s book, What Every Real Estate Investor Needs to Know About Cash Flow… And 36 Other Key Financial Measures, Updated Edition
, is a classic go-to reference book for real estate investors looking to size up a property’s profit potential.
Rental Property Calculator & Income Statement
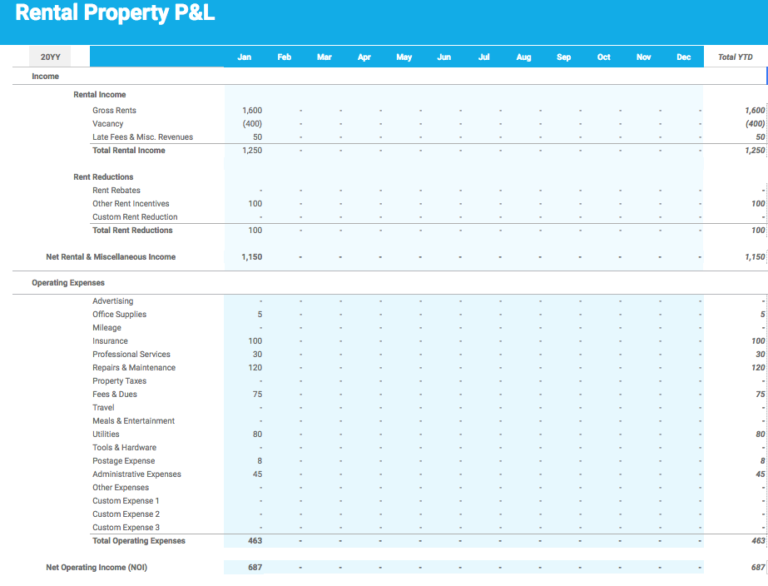
Successful Accidental Landlords know how to create financial statements and track performance to manage their investments. This section will walk you through an example Income Statement so you can create one for your own rental property business.
I’ve touched on many, but not all parts of a rental property income statement. I will complete the picture for you below.
Net Rental & Miscellaneous Income
I know you already track your monthly rent received. But you also need to track Miscellaneous Income from fees or utilities along with any reductions to rent such as vacancies or rent incentives.
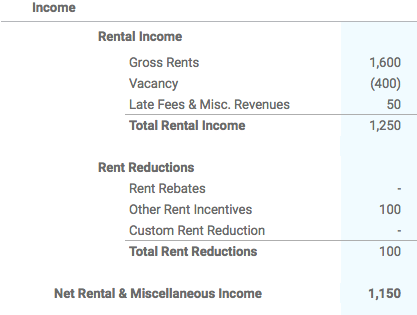
Total Rental Income – Rent Reductions = Net Rental & Miscellaneous Income
You can see from the template above that I track Gross Rents and then offset this with any vacancies. The net of the two is what I actually collected in rent for the period. I also add any miscellaneous income like application fees to this for Total Rental Income.
Rent reductions are tracked on a separate line item to facilitate analysis. You want to be able to spot any trends in rent reductions. If you continuously have to offer incentives or rebates to fill vacancies, it will be obvious on this line item.
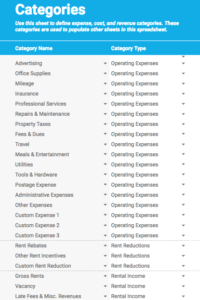
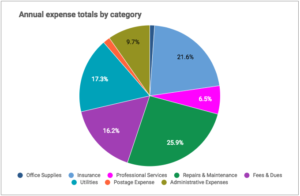
Operating Expenses
You will want to come up with your own list of common operating expenses that you want to track. Be sure to include a catchall account like “Other Expenses.” My template includes 15 common operating expenses with room for you to add 3 more custom expenses.
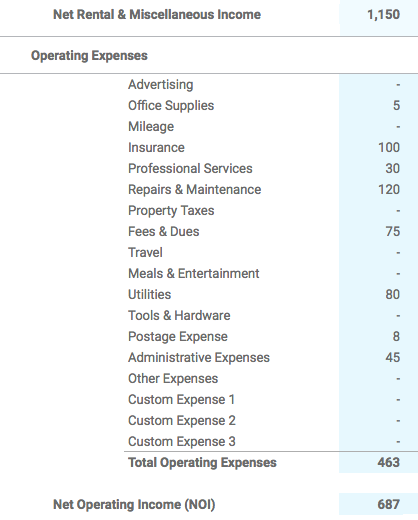
Net Rental & Miscellaneous Income – Operating Expenses = Net Operating Income
This is the net cash you received from your rentals after paying your expenses to run them. It is the cash left over to pay your mortgage and income taxes.
Debt Service
Debt service includes any mortgage interest or other interest expense you pay on your property. It DOES NOT include any principal pay-down. Other types of expenses could include a HELOC or even an HOA loan.
I was once part of condo association that would take loans out for projects and then assign a portion of the loan to each owner. It was a mess from a record-keeping standpoint but it was nice that I didn’t have to pay the full project cost up front. The interest on that loan goes in this section.
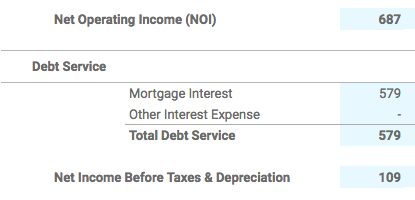
Net Operating Income – Debt Service = Net Income Before Taxes and Depreciation
Depreciation & Amortization
One of the best tax benefits of being a landlord is depreciation expense. Landlords get to expense the cost of buildings and assets over time. Below is the IRS table for the period each asset class is to be depreciated.
| ASSET TYPE | RECOVERY PERIOD |
|---|---|
| Computers, Printers, Hard Drives | 5 Years |
| Office Machines (Copier, Fax Machine) | 5 Years |
| Automobiles, Light Trucks | 5 Years |
| Appliances | 5 Years |
| Carpets | 5 Years |
| Rental Property Furniture | 5 Years |
| Office Furniture | 7 Years |
| Other Property Not Classified | 7 Years |
| Fences | 15 Years |
| Residential Rental Property | 27.5 Years |
| Structural Components (Furnace, Plumbing) | 27.5 Years |
| Land | Never Depreciated |
Figuring your depreciable cost basis and amortizing it appropriately is not simple so I highly recommend you use a skilled professional experienced with rental properties. You’d be surprised how many CPAs and Tax professionals miss the depreciation deduction.
Note that my template allows for “Other Amortization Expense” to accommodate the various types of assets you can depreciate including Appliances (5 Years), Office Equipment (7 years). You can customize this section to suit your personal needs.
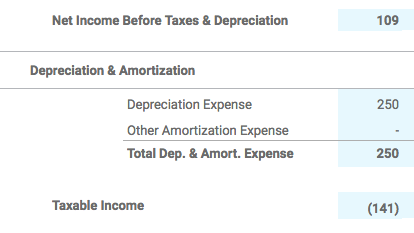
Net Income Before Taxes & Depreciation less Depreciation & Amortization = Taxable Income
Taxable Income
You can see in my example that the Net Income Before Taxes & Depreciation was positive $109 but the depreciation reduced the taxable income to negative $141. That’s the awesome power of depreciation! I didn’t have to pay anyone (again) for the $250 of depreciation but it saved me taxable income, which puts real money back in my pocket as an investor.
Net Income
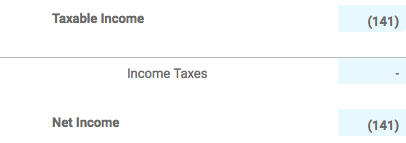
Taxable Income – Income Tax Expense = Net Income.
This is an accounting metric. It’s not useful to most landlords but tracking it over time will show you how your business is growing overall. I recommend tracking your total Net Income but focusing on the measures I highlighted in the “Ratios” section of my template.
Note that in this example there is no negative Income Tax Expense despite having a negative taxable income. That is because most landlords will be subject to Passive Activity Loss Suspension rules. This means your tax loss is suspended until you dispose of the property or realize a profit. Learn more about Passive Activity Loss Suspension rules and how landlords can potentially put those losses to use.
Conclusion
Managing a rental property is hard work. It’s easy to forget it’s a business like any other when you are dealing with emotional tenants and leaking pipes. Awesome landlords not only know how to deal with tenant and property issues, but also know how their business is performing financially.
The three financial ratios above will have the biggest impact on your rental property cash flow. Learning how to build an Income Statement and track these metrics over time will help you understand if your business is headed in the right direction. I’ve even made it super simple for you if accounting isn’t your thing. Simply download my rental property calculator and start tracking your rental business today!
Don’t Forget Your Free Rental Property Calculator!
Sign up for my monthly newsletter to get instant access to my exclusive, customizable Rental Property Calculator in Google Sheets used throughout this article. I’ve done all of the hard work for you and modified a Google Sheet provided by Xero (thanks Xero!) for a typical Accidental Rental property businesses.
Simply enter transactions and get a snapshot of how your rental business is performing, including the critical ratios discussed above. Just fill in the sign up fields below and you will receive instant access!
Customize it to suit your business needs.
Get real-time reports on where you are spending money.
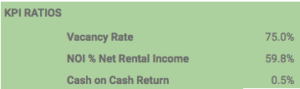
Track your KPIs over time!
Start tracking your rental business today!